
Nasa Earth Data Map
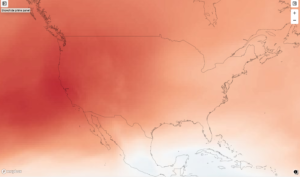
Nasa new Earth Data map shows more intense CO2 over heavily populated areas like the West Coast of the US
Sparsely populated areas like those that mine Coal have the least environmental damage from CO2.
Please look up your own CO2 levels in your City or Local Areas
This layer shows changes in carbon dioxide (CO₂) levels during coronavirus lockdowns versus previous years. Redder colors indicate increases in CO₂. Bluer colors indicate lower levels of CO₂.
Unfourtantly C)2 levels are back on the rise on the West Coast.
https://earthdata.nasa.gov/covid19/explore/sf?map=-122.0854%2C37.7401%2C8.65&date=2021-01-01&lState=nightlights-hd%7C0%7C0
Please follow and like us:
Comments are currently closed.